By Lyndsey Stram, Regional Economist; Lecia Parks Langston, Senior Economist
“You have power over your mind — not outside events. Realize
this, and you will find strength.” Marcus Aurelius
In the wake of the COVID-19 pandemic, businesses lost revenues and workers lost jobs. But because of the time it takes to collect and collate data, economists have been left without much information to quantify the economic impacts at the local level.
But there is one ray of data illumination. Claims for unemployment benefits are promptly available and provide information about a large cross section of the economy. This post will outline what light unemployment claims data sheds on the state of the Wasatch Front South Region’s economy.
While not all workers are protected by unemployment insurance laws, roughly 95% of jobs are covered. This makes claims data an exceptional source of information about the economy. Not included under unemployment insurance laws are most self-employed workers, about half of agricultural employment, unpaid family workers, railroad personnel (covered separately) and many nonprofit organizations (such as churches). Also, some out-of-work employees may not have worked a sufficient work history to qualify for unemployment insurance benefits, but may file anyway.
Fortunately, in this time of economic distress, the social safety nets of the unemployment insurance program, special national COVID-19 funding and social programs are working together to keep workers’ income and well-being stable.
Unemployment claimants and the unemployed; they aren’t the same
Also, keep in mind that, in addition to individuals drawing unemployment benefits, the unemployment rate includes those entering and re-entering the workforce and noncovered groups without current employment. This means the number of “unemployed” will be greater than the number of claimants. In “normal” times, only about 40% of the “unemployed” are claiming benefits.
The generally reported unemployment rate also has a work-search requirement. If you haven’t made any minimal attempts to find work, you aren’t counted as “unemployed.”
Watch this Space
While this analysis won’t be updated on a regular basis, new data will be added to the data visualization on a weekly basis allowing readers to check back for the latest information.
An Unprecedented Event
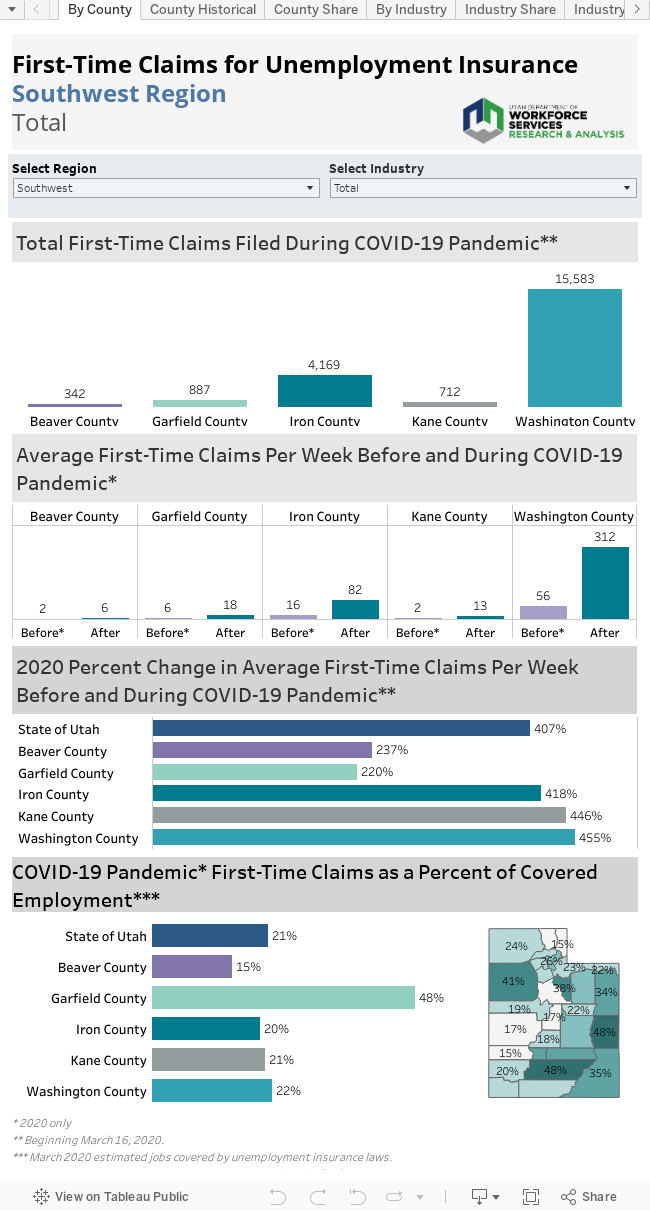
Not surprisingly, first-time claims for unemployment benefits soared in Utah and across the nation as the pandemic swept across the country. Week 12 (beginning March 16) marks the beginning of the unprecedented surge in claims. Claims in the Wasatch Front South Region peaked in week 14 and have been decreasing since. At that peak, 15,389 claims were filed between Salt Lake and Tooele Counties. By week 19, the claims are considerably lower while still remaining well above levels seen previously, even during the Great Recession of 2008-2009.
Prior to the COVID-19 pandemic, Salt Lake and Tooele Counties saw an average of 492 and 31 first-time claims per week. In the weeks since the restrictions, those numbers skyrocketed to 8,270 average weekly claims for Salt Lake and 387 in Tooele. This is an increase of 1,580% and 1,133% respectively.
Who took the hardest hit?
While Salt Lake has certainly had the lion’s share of the claims by number in the region, a much larger percent of Tooele’s covered employees have filed claims. Roughly 18% of the covered workforce has filed a claim in Tooele County, while 9% have in Salt Lake. As Salt Lake is the employment center for much of the state, it’s not surprising that a smaller portion has been affected here.
Tourism and COVID-19
In the Wasatch Front South Region, 20% of the post-COVID-19 initial claims filed corresponded to workers from the accommodations and food services industries. In addition, the true effect of the pandemic on this industry is masked by a large number of claims classified as industry “unknown” in the early days of the claims flood. Undoubtedly, many of these claims would rightfully be classified in accommodations/food services if the appropriate information were available.
Other high-claims industries include arts/entertainment/recreation, retail trade and healthcare and social assistance (reflecting the cessation of elective procedures and visits).
The Industry Flow
While most of the high-claims industries felt the pain of restrictions early on, other industries surged in later weeks. As the economic effects of other closures worked their way through the economy both manufacturing and transportation/warehousing proved relative latecomers to the layoffs in Salt Lake and Tooele.
The High and the Low
While accommodations and food services had the largest number of claims in Salt Lake and Tooele Counties, other industries have seen similar shares of claims, in percentage terms. Arts/entertainment/recreation had a first time claims rate of 20% of its covered workforce, equal to that of the accommodations/food services sector.
Sectors that had lower than average shares of claims include mining, construction, manufacturing, wholesale trade, utilities, information, finance and insurance, professional scientific and technical services, management, education and public administration.
County by County
Salt Lake County
• Prior to the COVID-19 pandemic, Salt Lake County averaged 492 first-time claims per week. During the pandemic, this increased 1,580% to 8,270 weekly claims.
• Salt Lake County has a diverse economy and some of the weaker hit sectors have served to buoy those hardest hit.
• New claims, as a percent of covered employment, measured at 9% — in the mid-range when compared to other Utah counties.
• Accommodations/food services and retail trade accounted for the largest shares of claims in Salt Lake County.
Tooele County
• Prior to the COVID-19 pandemic, there was an average of 31 claims per week. During the pandemic, this increased 1,133%, to 387 average weekly claims.
• New claims, as a percent of covered employment, measured at 18%. This is one of the highest rates in the state.
• Unknown industries accounted for 373 claims out of Tooele County, corresponding to a sizeable 13% of the claims in the county.
• Other large shares of the initial claims in Tooele come from administrative support/waste management/remediation, healthcare/social assistance, manufacturing and professional scientific and technical services.
But there is one ray of data illumination. Claims for unemployment benefits are promptly available and provide information about a large cross section of the economy. This post will outline what light unemployment claims data sheds on the state of the Wasatch Front South Region’s economy.
While not all workers are protected by unemployment insurance laws, roughly 95% of jobs are covered. This makes claims data an exceptional source of information about the economy. Not included under unemployment insurance laws are most self-employed workers, about half of agricultural employment, unpaid family workers, railroad personnel (covered separately) and many nonprofit organizations (such as churches). Also, some out-of-work employees may not have worked a sufficient work history to qualify for unemployment insurance benefits, but may file anyway.
Fortunately, in this time of economic distress, the social safety nets of the unemployment insurance program, special national COVID-19 funding and social programs are working together to keep workers’ income and well-being stable.
Unemployment claimants and the unemployed; they aren’t the same
Also, keep in mind that, in addition to individuals drawing unemployment benefits, the unemployment rate includes those entering and re-entering the workforce and noncovered groups without current employment. This means the number of “unemployed” will be greater than the number of claimants. In “normal” times, only about 40% of the “unemployed” are claiming benefits.
The generally reported unemployment rate also has a work-search requirement. If you haven’t made any minimal attempts to find work, you aren’t counted as “unemployed.”
Watch this Space
While this analysis won’t be updated on a regular basis, new data will be added to the data visualization on a weekly basis allowing readers to check back for the latest information.
An Unprecedented Event
Not surprisingly, first-time claims for unemployment benefits soared in Utah and across the nation as the pandemic swept across the country. Week 12 (beginning March 16) marks the beginning of the unprecedented surge in claims. Claims in the Wasatch Front South Region peaked in week 14 and have been decreasing since. At that peak, 15,389 claims were filed between Salt Lake and Tooele Counties. By week 19, the claims are considerably lower while still remaining well above levels seen previously, even during the Great Recession of 2008-2009.
Prior to the COVID-19 pandemic, Salt Lake and Tooele Counties saw an average of 492 and 31 first-time claims per week. In the weeks since the restrictions, those numbers skyrocketed to 8,270 average weekly claims for Salt Lake and 387 in Tooele. This is an increase of 1,580% and 1,133% respectively.
Who took the hardest hit?
While Salt Lake has certainly had the lion’s share of the claims by number in the region, a much larger percent of Tooele’s covered employees have filed claims. Roughly 18% of the covered workforce has filed a claim in Tooele County, while 9% have in Salt Lake. As Salt Lake is the employment center for much of the state, it’s not surprising that a smaller portion has been affected here.
Tourism and COVID-19
In the Wasatch Front South Region, 20% of the post-COVID-19 initial claims filed corresponded to workers from the accommodations and food services industries. In addition, the true effect of the pandemic on this industry is masked by a large number of claims classified as industry “unknown” in the early days of the claims flood. Undoubtedly, many of these claims would rightfully be classified in accommodations/food services if the appropriate information were available.
Other high-claims industries include arts/entertainment/recreation, retail trade and healthcare and social assistance (reflecting the cessation of elective procedures and visits).
The Industry Flow
While most of the high-claims industries felt the pain of restrictions early on, other industries surged in later weeks. As the economic effects of other closures worked their way through the economy both manufacturing and transportation/warehousing proved relative latecomers to the layoffs in Salt Lake and Tooele.
The High and the Low
While accommodations and food services had the largest number of claims in Salt Lake and Tooele Counties, other industries have seen similar shares of claims, in percentage terms. Arts/entertainment/recreation had a first time claims rate of 20% of its covered workforce, equal to that of the accommodations/food services sector.
Sectors that had lower than average shares of claims include mining, construction, manufacturing, wholesale trade, utilities, information, finance and insurance, professional scientific and technical services, management, education and public administration.
County by County
Salt Lake County
• Prior to the COVID-19 pandemic, Salt Lake County averaged 492 first-time claims per week. During the pandemic, this increased 1,580% to 8,270 weekly claims.
• Salt Lake County has a diverse economy and some of the weaker hit sectors have served to buoy those hardest hit.
• New claims, as a percent of covered employment, measured at 9% — in the mid-range when compared to other Utah counties.
• Accommodations/food services and retail trade accounted for the largest shares of claims in Salt Lake County.
Tooele County
• Prior to the COVID-19 pandemic, there was an average of 31 claims per week. During the pandemic, this increased 1,133%, to 387 average weekly claims.
• New claims, as a percent of covered employment, measured at 18%. This is one of the highest rates in the state.
• Unknown industries accounted for 373 claims out of Tooele County, corresponding to a sizeable 13% of the claims in the county.
• Other large shares of the initial claims in Tooele come from administrative support/waste management/remediation, healthcare/social assistance, manufacturing and professional scientific and technical services.