Consumer spending makes up around 68 percent of the nation’s
gross domestic product. Consumer spending is individuals and families
purchasing groceries, clothing, recreation, stocks, insurance, education and much
more. The transactions cover a broad swath of economic activity.
Much of the nation’s consumer spending is captured via retail trade. A useful retail trade definition is “the re-sale (sale without transformation) of new and used goods to the general public, for personal or household consumption or utilization.” Not all consumer spending is captured through retail trade transactions, but a large share is.
Whereas in the past nearly all retail transactions were done through traditional brick-and-mortar stores, now a significant and growing segment is diverted to internet sales. The consumer shops online and FedEx (or like) delivers the product. One can see that the number of brick-and-mortar stores and the level of local sales across the country are being endangered by this economic evolution.
The brick-and-mortar reduction is beginning to show its economic presence in the United States employment numbers. While the U.S. economy is finally expanding at a healthy pace this side of the Great Recession, one of the few industries not rising with this tide is retail trade. While overall retail sales are increasing, employment is not.
Traditionally, as a population increases, retail trade employment grows simultaneously, since population growth and consumer spending volume is an integrated dynamic. If studied deeply, a certain ratio of retail trade employment growth spawned from population growth would emerge. Before the internet, the vast majority of all consumer sales occurred in the immediate community or region. But now, the internet is diverting these sales away from the local community — and with internet sales growing, its market share will increase.
We do not yet know how much brick-and-mortar erosion will eventually occur. And will such a phenomenon hit some areas more than others (e.g., urban vs. rural, or local vs. tourist spending)? These are touch points that economists will be watching as this internet sales phenomenon continues to grow within the national and Utah economies.
In light of this change, in this quarter’s Local Insights we are profiling retail trade employment throughout Utah’s local regions. This can offer a profile of where retail trade is now in a local economy, and possibly how much of the sector could become vulnerable to the internet-sales phenomenon.
All regions can be viewed through the Local Insights web portal. The following is a retail trade profile for the Wasatch Front South region:
Measuring
Retail – NAICS Codes
In order to explore the relationship between internet and brick-and-mortar retail we need to look at data grouped through the North American Industry Classification System (NAICS), which “is the standard used by Federal statistical agencies in classifying business establishments.” Stated simply, the NAICS groups businesses together based upon what they do.
Hierarchical in nature, the NAICS begins with a broad categorization and narrows its focus at subsector levels. As an example, the educational services sector includes all institutions focused on providing instruction and training. At the subsector levels, that focus is narrowed so that data from elementary schools, colleges and trade institutions are separated.
In the case of retail, a broad sector known as retail trade includes several underlying categories such as: motor vehicle sales, furniture stores, electronics stores, building material stores, grocery stores, pharmacies, gas stations, clothing stores and department stores, among others.
Then there is the relatively new and emerging part of the retail trade sphere — non-store retailers. These are establishments that sell products primarily on the internet or through direct selling. Examples include Amazon, Overstock.com, Young Living and dōTERRA. These types of retailers have grown rapidly in the past 15 years and their presence is reshaping the retail trade landscape. We will look at this subsector in a later section.
Retail in the Wasatch Front South
In 2016, retail trade accounted for 10.5 percent of employment in Salt Lake County making it the second largest industry with more than 72,000 jobs. In Tooele, retail is nearly 12 percent of the nonfarm workforce and is the largest industry with 1,900 jobs. The three largest retail subsectors in the Wasatch Front South are general merchandise stores, food and beverage stores, and motor vehicle and part dealers. These three account for 45 percent of retail employment in the area and are responsible for nearly a third of all taxable sales in the two counties.
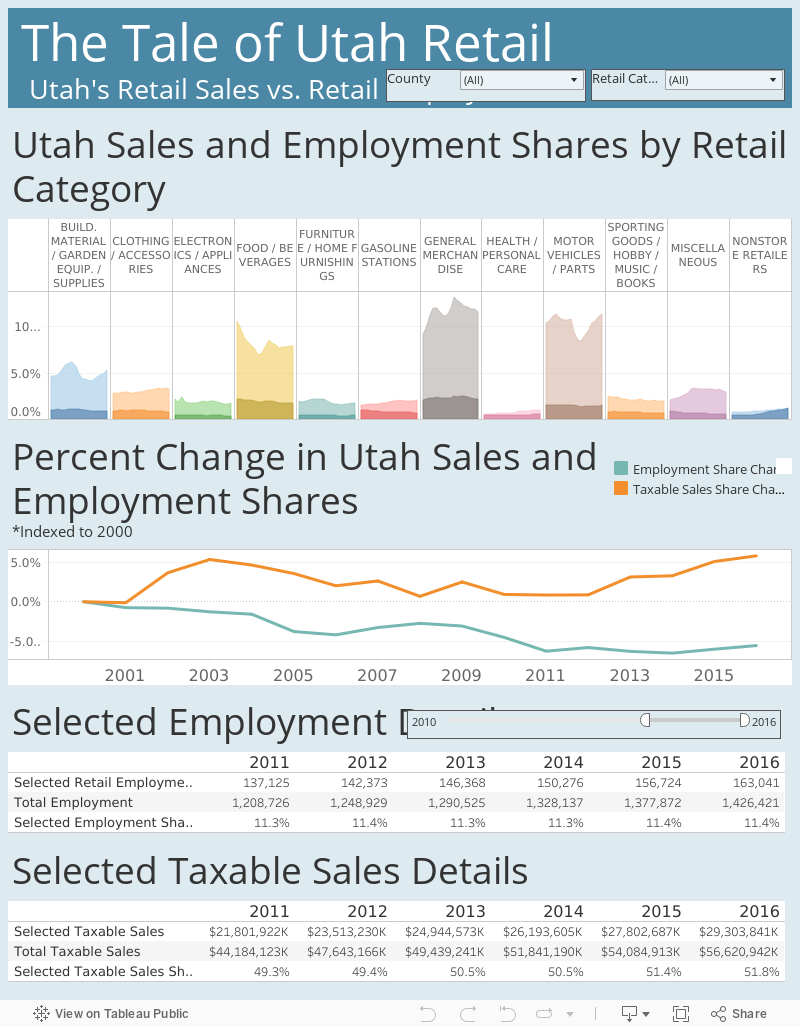
This and other data are represented in the visual below, which illustrates trends in retail employment and taxable sales between 2000 and 2016. From this visual we see that retails’ share of employment has declined in recent years. On the surface, this may indicate that the internet is replacing “vulnerable” brick-and-mortar jobs with employment in electronic shopping related industries.
While many of these online retail jobs are counted in non-store retailers, some worksites may be placed in other industries like transportation and warehousing. As an example, despite their online storefront, the distribution center for Backcountry.com in West Valley City is classified as a warehousing establishment. This structural difference between online and traditional retail may account for some of the employment share reduction, but to what extent is it driven by the internet supplanting vulnerable retail locations?
Infrastructure, Perishability and Behavior – Identifying Vulnerable Retail Sectors
One way to identify potential vulnerabilities in brick-and-mortar retail employment is to explore trends in e-commerce sales relative to total retail sales. While this data is unavailable at the region and state level it is provided for the U.S. Despite the lack of geographical specificity in the data, it captures trends and relationships in an industry where borders are disappearing due to the growing accessibility of the internet.
In order to identify vulnerable employment, we will identify subsectors which have been impacted most by online shopping. We can do this by looking at internet sales penetration within retail, which is the share of online sales for a particular subsector, and comparing it to employment in Salt Lake and Tooele counties. For this portion of the analysis, we will exclude non-store retailers and look at “traditional” brick-and-mortar retail groupings and their online sales.
Wasatch Front South Employment
vs. Internet Sales Penetration

This graph illustrates four main points about the connection/competition between brick-and-mortar and online stores.
First, not all industries are currently well-suited for internet sales and may lack the infrastructure required. This is seen primarily in the low online sales levels in general merchandise (one-stop shopping) and food/beverage (grocery) stores. While the idea of having all your groceries and toiletries shipped is appealing, the infrastructure to transfer these perishable goods to a large amount of households in a timely manner does not yet exist. Conversely, the electronics subsector appears to be much better suited for online sales. Perhaps it is because individuals purchasing technology are comfortable with using technology to purchase it.
The second insight we can glean from the graph is the impact of product on labor needs. A food and beverage store will require more employees to care for perishable goods relative to a furniture store where products rotate only a few times annually. Books, clothing and electronics are also examples of products requiring less labor to maintain. Therefore, the less maintenance an inventory requires, the higher the likelihood that it will transition to online sales.
Third, the motor vehicle and part dealer subsector is unique. While perishability of goods can explain the need for higher employment levels in the grocery groupings, a car doesn’t expire the way a gallon of milk does. While some of the higher employment in motor vehicles may be explained by a lack of infrastructure in shipping cars purchased online, it may be more of a behavioral driver. According to a 2015 Autotrader survey, 88 percent of consumers said they wouldn’t buy a car before a test drive.
These first three points illustrate that infrastructure, perishability and behavior all influence the degree to which certain retail groups sell online.
The final point is the negative relationship between
internet sales penetration and employment. In general, higher levels of internet
sales penetration are correlated to low regional employment in that industry.
This confirms visually that jobs gained with online retailers reduce employment
among traditional retail.
What About Non-Store Retailers?
As mentioned previously, the graph above excluded non-store retailers. In the Wasatch Front South area, this subsector employs more than 8,000 individuals, making it the fourth largest retail category. Since 2000, employment in this subsector has grown by 126 percent and taxable sales have grown by 66 percent. So why are non-store taxable sales gaining at a slower pace than employment?
This is primarily due to the fact that sales taxes are collected by the state of the purchaser, and then, only if the seller has a physical presence in that state. This means that when Overstock.com sells a rug to someone outside of Utah, there is money coming into Utah (in terms of the jobs that the sale supports), but there is no sales tax coming in to Utah. The only non-store sales taxes captured in Utah are Utah consumers purchasing goods from retailers with a presence in Utah. Since a large share of sales by local online retailers are to customers in other states, it means that sales tax revenue lags compared to employment growth in the industry.
This example illustrates one of the greatest difficulties in quantifying the impact of non-store retailers on brick-and-mortar locations. When Utah residents purchase tax-free goods from a non-store retailer like Amazon, whose sales are not broken out by NAICS subsectors (i.e., electronics, motor vehicle parts, and home furnishings), establishing a relationship between non-store and traditional retail is challenging.
Perhaps the state’s recent agreement with Amazon will be helpful in unraveling this puzzle. Amazon recently established a nexus with the state of Utah and therefore became obligated to collect sales taxes. Amazon reportedly captured 33 percent of all U.S. online purchases in 2015, according to the magazine Internet Retailer, up from 25 percent in 2012. In response to this development, revenue estimators for Salt Lake County have added a half percentage point to their estimate for 2017 sales tax collections.