Cory Stahle, Regional
Economist
Several of our past blog posts have highlighted the
statewide education levels of Utah; however, little has been written about the
educational makeup of counties and regions. The 2014 American Community Survey
(ACS), released December 2015, provides data that profiles education levels by
county. This article will focus primarily on the Wasatch Front South Region and
its counties.
Understanding educational attainment for an area is
important for two reasons. First, it is generally acknowledged that obtaining
higher education yields increased income. This increase can then improve living
standards and aid in long-term economic growth. Second, education is both a
product and driver of the types of jobs available. A highlight of the
educational characteristics in the Wasatch Front South Region follows.
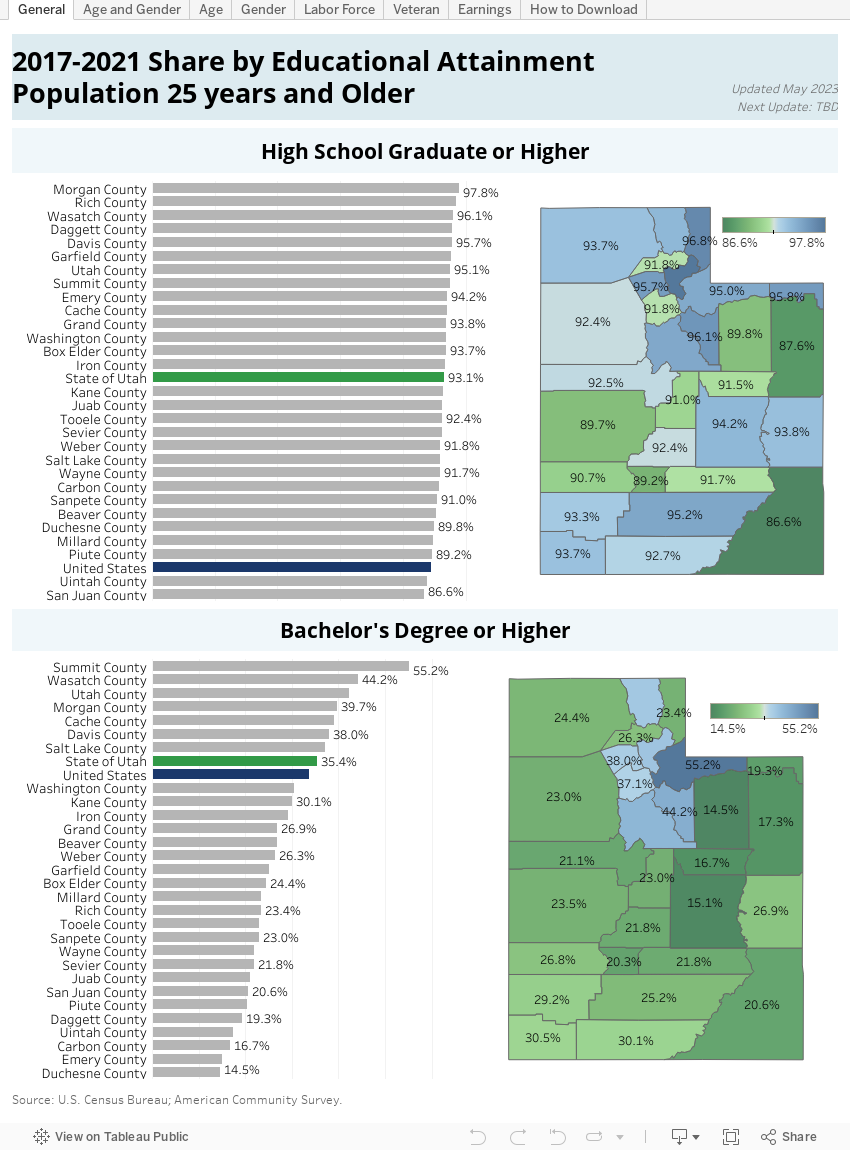
According to the 2014 ACS, 31 percent of individuals 25 years and older held a
bachelor’s degree or higher in the region. Salt Lake County mirrored the region
at 31 percent while Tooele County was lower at 21 percent. When compared in the
graphic below, Salt Lake County is above the national average for bachelors and
higher and is near the state average. In contrast, Tooele County falls below
the nation and state in advanced degrees but is significantly higher in both
high school and some college/associates education. While many Tooele County
residents commute outside the county for work, lack of local employer demand
for workers with advanced education is one possible explanation for the
bachelor’s degree lag.

Within the population, the ACS distinguishes between those
who are in the labor force and those who are not. The labor force includes both
individuals who are employed and those who are unemployed but would like to
work. As seen below, the labor force share of individuals who have attended
and/or graduated from college is comparable to the state and nation.

When broken down by gender and age, the region mirrors
national trends. In line with the nation, females in younger generations are surpassing
males in college graduation rates. Among individuals aged 65 and over in the
region, the share of males with a bachelor’s degree or higher is 17
percentage-points above females. This gap in shares narrows to 6
percentage-points for the 45-to-64-year-old category, and equalizes in the 35-to-44-age
range. The trend is most evident between the ages of 25 and 34 where the female
share exceeds males by 5 percentage-points (see table below).

Given this trend and the positive relationship between
education and income, one would expect higher female wages relative to men.
However, this outcome is not discernable in the ACS data. For the region,
females earn 58 percent of male wages across all education levels.
This gap in the earnings data may be caused by a collection
of factors outside of gender alone. One factor may be the choice of women to
work lower paying, part-time jobs in favor of flexibility. At the state level,
the U.S. Bureau of Labor Statistics (BLS) estimates that nearly 35 percent of
all female employees work part time. Of those working part-time, a BLS survey
found that fewer than 10 percent would prefer full-time employment instead. A
second factor stems from the methodology of the ACS data, which includes all
individuals with any earnings, even if they are low. For example, a
stay-at-home mother may participate in direct sales of herbal oils and receive
$2,000 a year in income. These earnings are then included in the calculation
for all females and contribute to lowering the median income statistic.
One final highlight from the ACS is the relationship between
education and unemployment. Region-wide, the estimated unemployment rate for
less-than-high-school graduates is 10 percent. In contrast, this number falls
to 3 percent for individuals with bachelor’s degrees and above. Both Salt Lake
and Tooele counties show a smooth decrease in unemployment rates as the level
of education increases.
For additional information on educational attainment see the interactive visual below.